Hello!
The heat is finally starting to return to our sunny Southern California communities, and just in time for California's re-opening and our first post-pandemic summer! Walking around you can actually feel the energy and life that has been reinvigorated throughout Los Angeles over the last month. It is clear our community is ready to celebrate coming out healthy on the other side.
I am so excited that we can finally hold open houses again! We don't have to limit the number of people in the homes and we don't have to fill out our Coronavirus forms prior to entry. It's a happy time for Real Estate Agent!
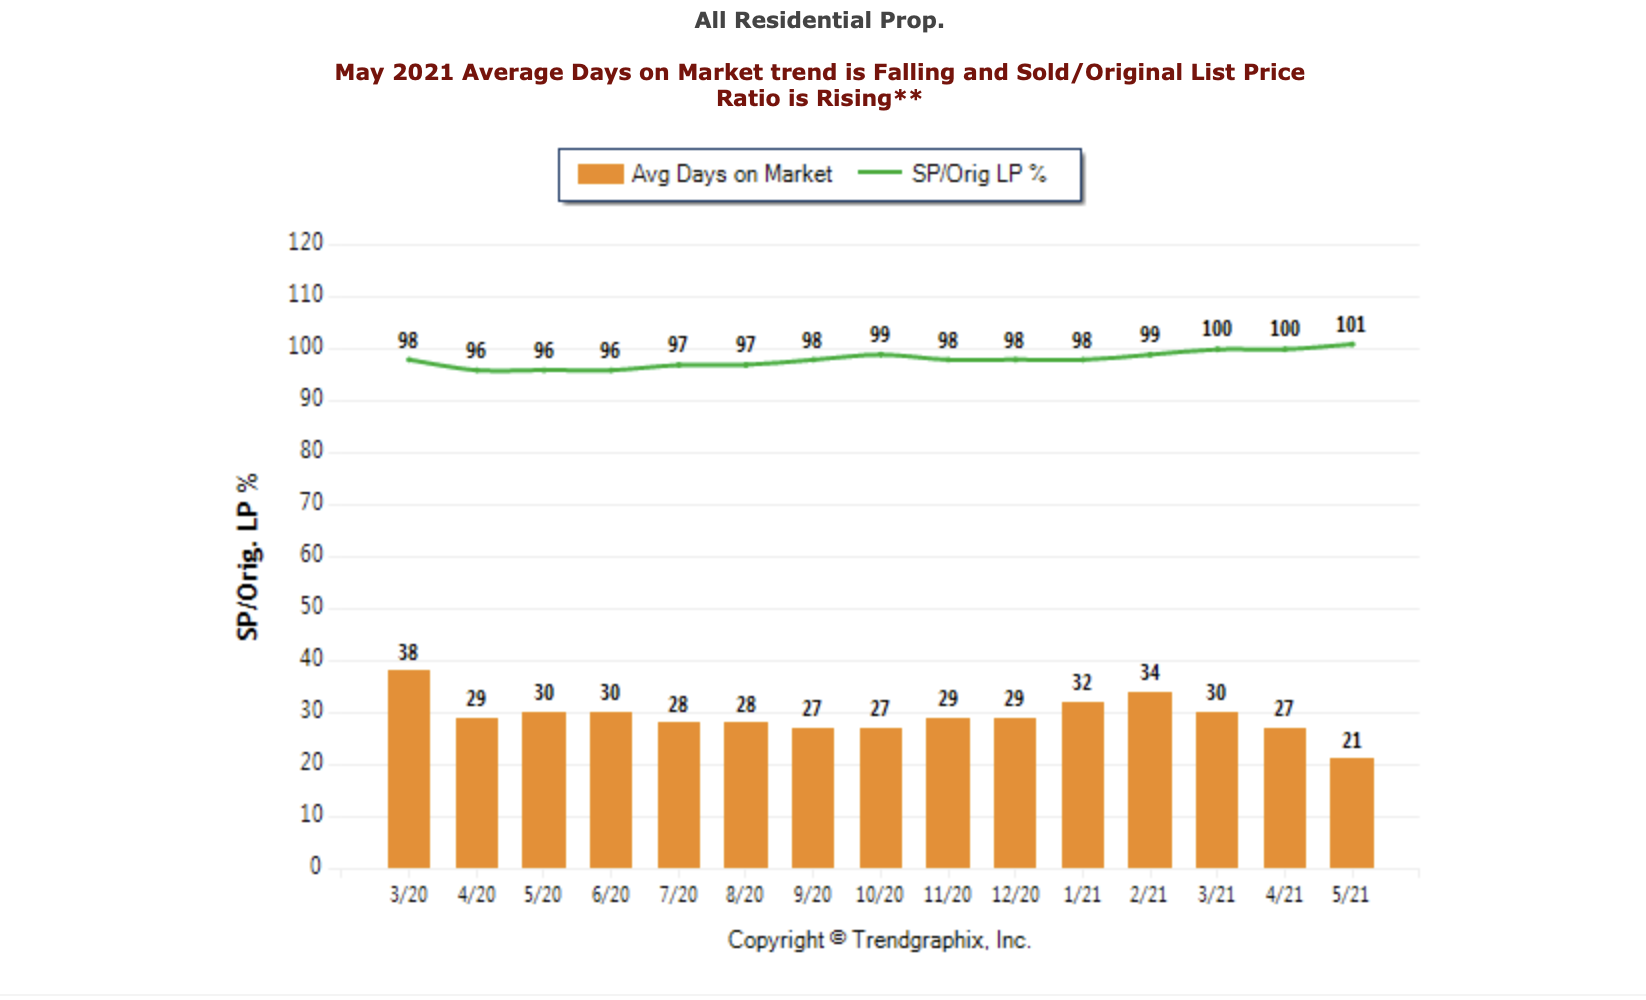
The chart below shows the “Average Days on Market” and “Sold/List Price Percentage” from March 2020 to May 2021 in the County of Los Angeles. It is typically taking about a month or less for homes to sell. Since the start of the spring selling season, this number has dropped significantly, homes are consistently selling in under a month and above asking price.
What do these numbers mean for you? The market imbalance between supply and demand is likely to continue to cause upward pressure on home prices over the next few months. If you are looking to sell soon, right now truly is an ideal time to jump into the market while inventory is still low!
Click on the name of your neighborhood below the chart for the specific statistics in your area, then give me a call so we can discuss how these numbers may impact your current real estate goals.
The heat is finally starting to return to our sunny Southern California communities, and just in time for California's re-opening and our first post-pandemic summer! Walking around you can actually feel the energy and life that has been reinvigorated throughout Los Angeles over the last month. It is clear our community is ready to celebrate coming out healthy on the other side.
I am so excited that we can finally hold open houses again! We don't have to limit the number of people in the homes and we don't have to fill out our Coronavirus forms prior to entry. It's a happy time for Real Estate Agent!
The chart below shows the “Average Days on Market” and “Sold/List Price Percentage” from March 2020 to May 2021 in the County of Los Angeles. It is typically taking about a month or less for homes to sell. Since the start of the spring selling season, this number has dropped significantly, homes are consistently selling in under a month and above asking price.
What do these numbers mean for you? The market imbalance between supply and demand is likely to continue to cause upward pressure on home prices over the next few months. If you are looking to sell soon, right now truly is an ideal time to jump into the market while inventory is still low!
Click on the name of your neighborhood below the chart for the specific statistics in your area, then give me a call so we can discuss how these numbers may impact your current real estate goals.
Data for your neighborhood:
Beverly Hills — El Segundo — Hawthorne — Hermosa Beach — Lomita — Long Beach — Manhattan Beach
Marina Del Rey — Palos Verdes Estates — Playa Del Rey — Playa Vista — Rancho Palos Verdes
Redondo Beach — Rolling Hills Estates — San Pedro — Torrance — Westchester
So what are your plans for the summer? Are you finally taking that vacation you have been delaying for months? Or perhaps you are just staying local so you can relish in the joys of summer we did not get to fully experience last year in our beautiful coastal and beach communities. Whatever your plans may be I would love to hear them! Give me a call or email me back to let me know what your plans are or if you have any questions about the real estate market. I am always happy to help! I look forward to hearing from you soon.
Wishing you a happy and healthy summer,


First Name Last Name
Title
Primary Phone
DRE# License
www.angeliquelyle.com
Street Number Street Name, City, State ZIP/Postcode
*Current vs. Prev Month: Median Sold Price 0.8% | Avg. Active Price 2.2% | Avg. Sold Price -1.3% Current vs. Same Month 1 Yr Ago: Median Sold Price 4.1% | Avg. Active Price 12.7% | Avg. Sold Price 0.5% * All reports presented are based on data supplied by the CARETS. trendgraphix.com

© 2021 Vista Sotheby's International Realty. All rights reserved. The Sotheby’s International Realty® and the Sotheby’s International Realty Logo are service marks licensed to Sotheby's International Realty Affiliates LLC and used with permission. Vista Sotheby's International Realty fully supports the principles of the Fair Housing Act and the Equal Opportunity Act. Each franchise is independently owned and operated. Any services or products provided by independently owned and operated franchises are not provided by, affiliated with or related to Sotheby’s International Realty Affiliates LLC nor any of its affiliated companies. If your property is listed with a real estate broker, please disregard. It is not our intention to solicit the offerings of other real estate brokers. We are happy to work with them and cooperate fully. Information herein is deemed reliable but not guaranteed.
DRE# 01922362
This email was sent to Email.
Don't want to receive emails from First Name Last Name? Unsubscribe here.
Powered by ActivePipe
DRE# 01922362
This email was sent to Email.
Don't want to receive emails from First Name Last Name? Unsubscribe here.
Powered by ActivePipe